Recently, data collectors at the College Crisis Initiative completed a collection on how different colleges and universities across the US planned for Spring Break (2021) during the COVID-19 pandemic.
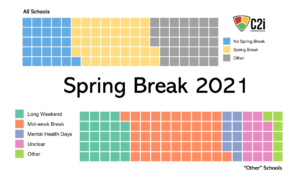
The top waffle graph summarizes the break down in Spring Break plans by “No Spring Break”, “Spring Break”, and “Other” (a different type of spring break). 26.3 % of institutions had no break scheduled, while 40.8% had a regular spring break scheduled. Interestingly, 32.8% of institutions had some “other” type of spring break.
The waffle graph below differentiates the various types of “other” unique spring break plans that many institutions chose to implement this semester. 46.6 % of institutions in the “other” category scheduled one or more breaks during the week, 23.6% of institutions scheduled a long weekend, 9.1% of institutions scheduled a mental health day or a surprise break for the students, 14 % still had an unclear plan, and 6.4% had some other sort of break planned.
Our data on spring break plans were recently featured on NPR: https://www.npr.org/2021/03/16/977568407/colleges-canceled-spring-break-but-students-are-traveling-anyway
Waffle Graph 1
| Spring Break Type | Count | Percent (%) | |
| 1 | No spring break scheduled | 517 | 26.3 |
| 2 | Spring break scheduled | 800 | 40.8 |
| 3 | Other | 644 | 32.8 |
Waffle Graph 2- Spring Break “Other” Type
| “Other” Type | Count | Percent (%) | |
| 1 | Long Weekend | 300 | 46.6 |
| 2 | Mental Health Days /Surprise Breaks | 152 | 23.6 |
| 3 | One or more mid-weekdays off | 91 | 14.1
|
| 4 | Other | 59 | 9.1 |
| 5 | Unclear Plan | 41 | 6.4 |
Data Analysts: Gracie Petty & Danya Rangachar
Leave a Reply